Last updated: July 1, 2026
If you are looking for classroom anchor chart ideas that make a real difference, you have come to the right place. We are sharing the most effective, teacher-tested charts that help students retain information, build independence, and stay engaged all year long.
You will find ideas organized by subject, grade level purpose, and display strategy so you can put these to work in your classroom starting today.
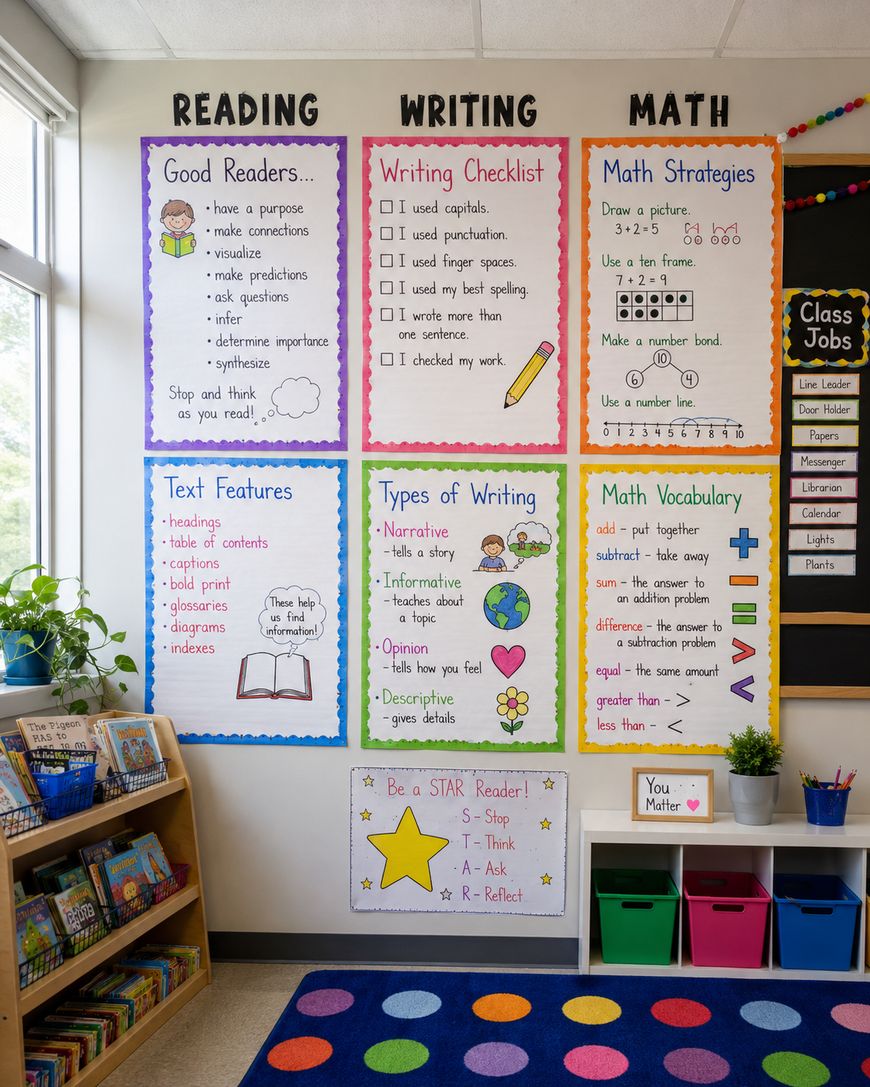
Reading and Writing Anchor Chart Ideas
Reading and writing anchor charts are some of the most impactful you can make because students need constant reinforcement of literacy strategies throughout the day.
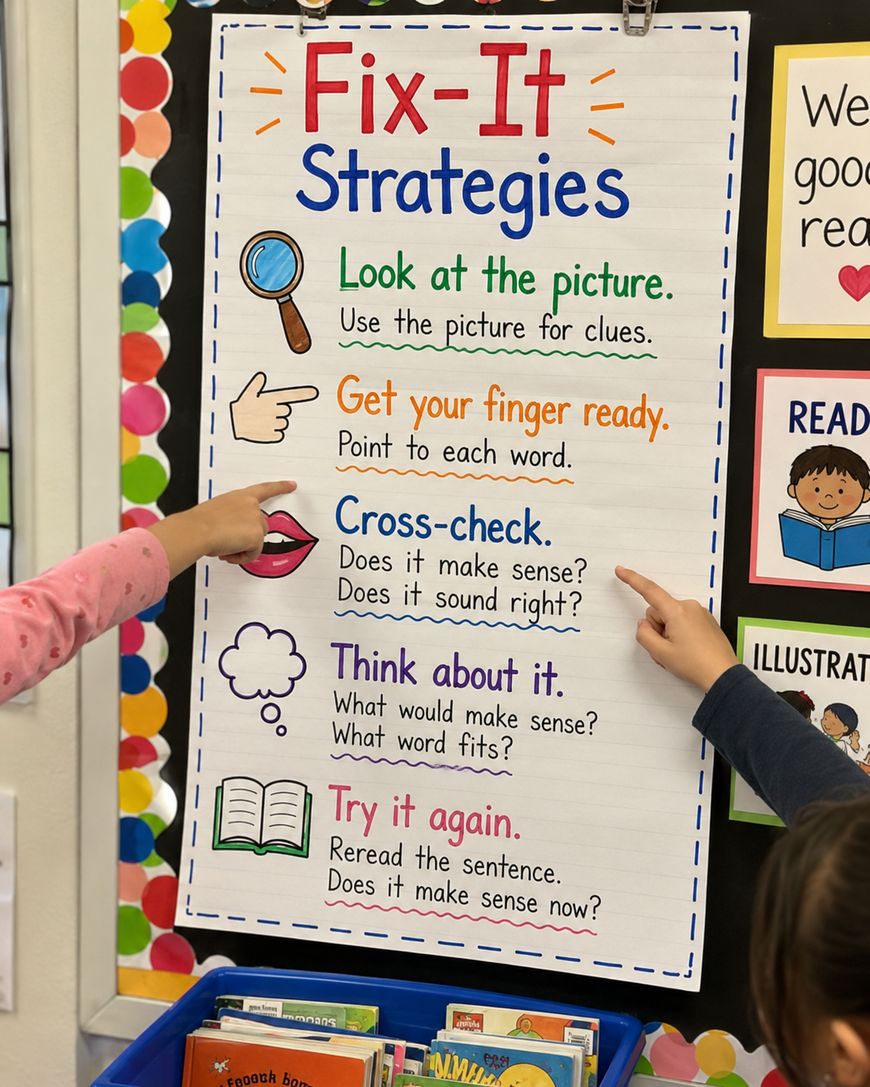
A “Fix-It Strategies” chart for reading lists what students should do when they come to a tricky word: look at the picture, sound it out, skip and come back, reread the sentence, or look for chunks they know. Pairing each strategy with a small icon makes this chart accessible even for early readers who cannot read all the words yet.
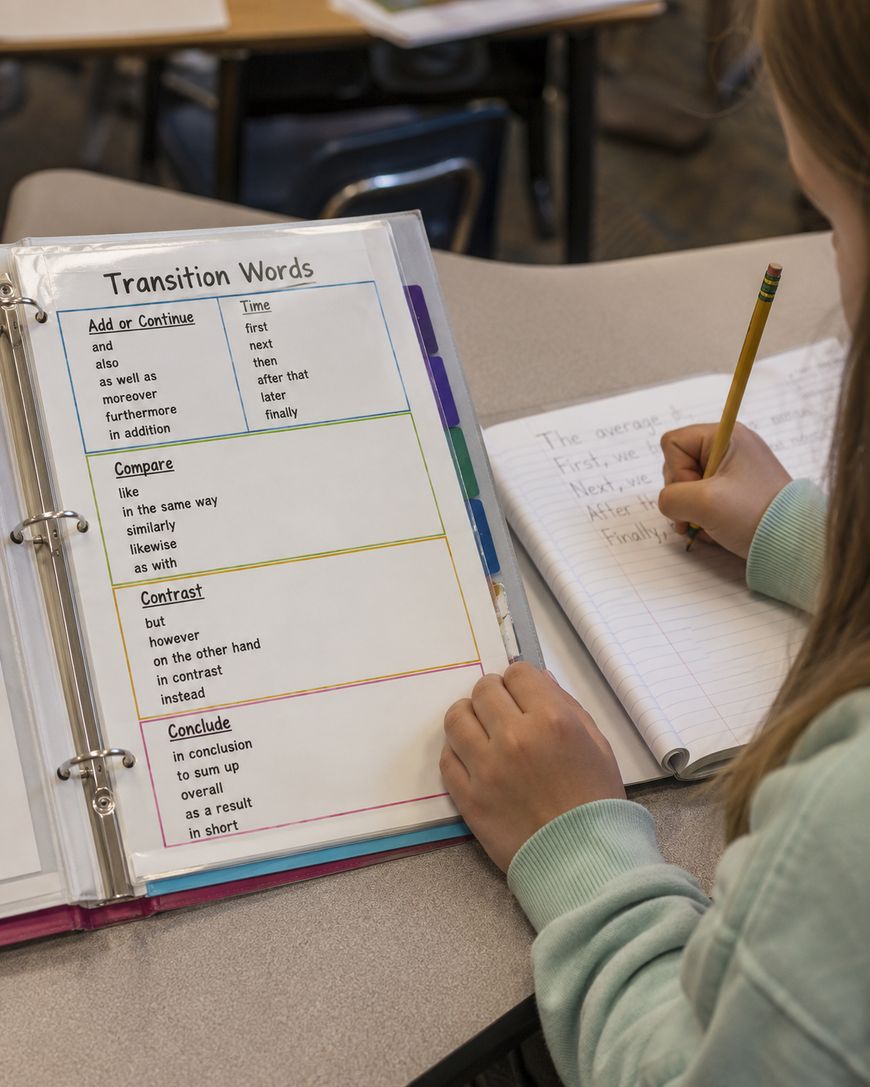
For writing, a “Types of Sentences” chart showing statement, question, exclamation, and command with color-coded examples gives students a quick reference during independent work. Adding student-generated example sentences to the chart makes it even more meaningful. Another fan favorite is a “Transition Words” chart organized by purpose: to add information, to show sequence, to compare, or to conclude. Students who struggle with paragraph flow consult this one constantly.
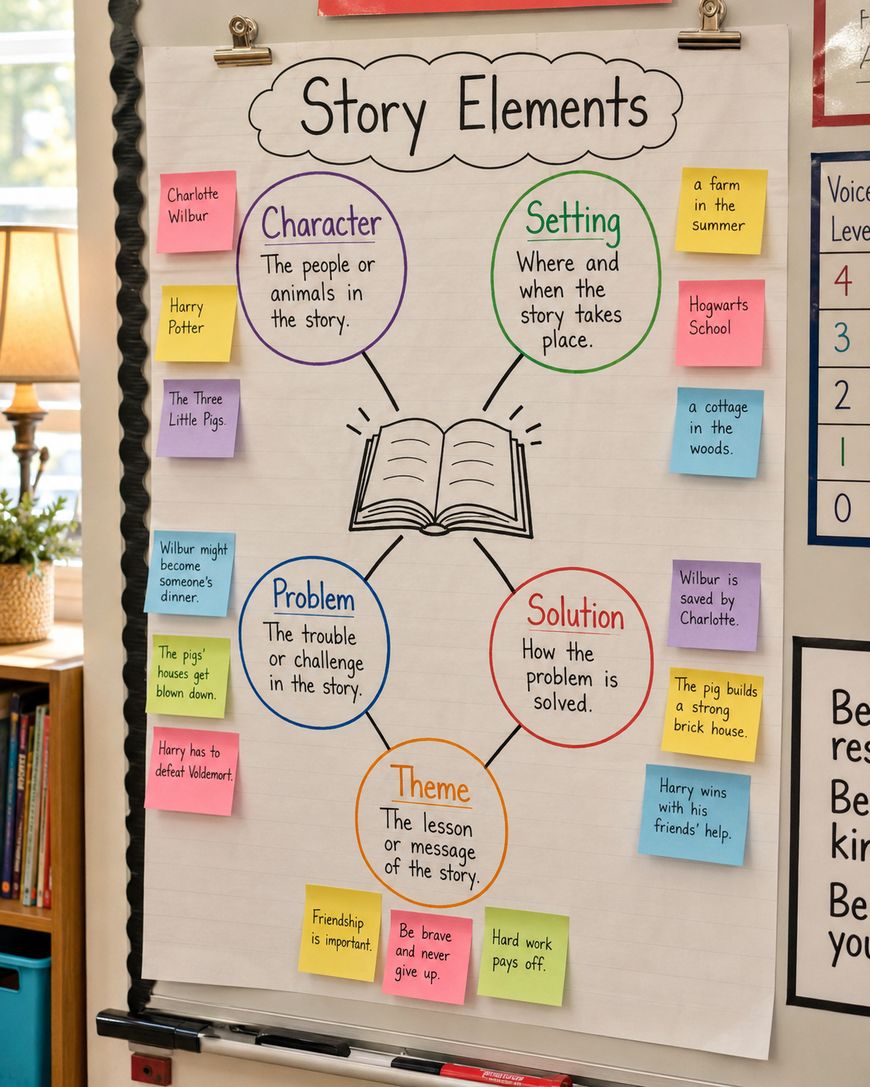
A “Story Elements” anchor chart covering character, setting, problem, solution, and theme pairs beautifully with any read-aloud. Drawing a simple story map around the terms helps visual learners see how the elements connect to one another rather than as isolated vocabulary words.
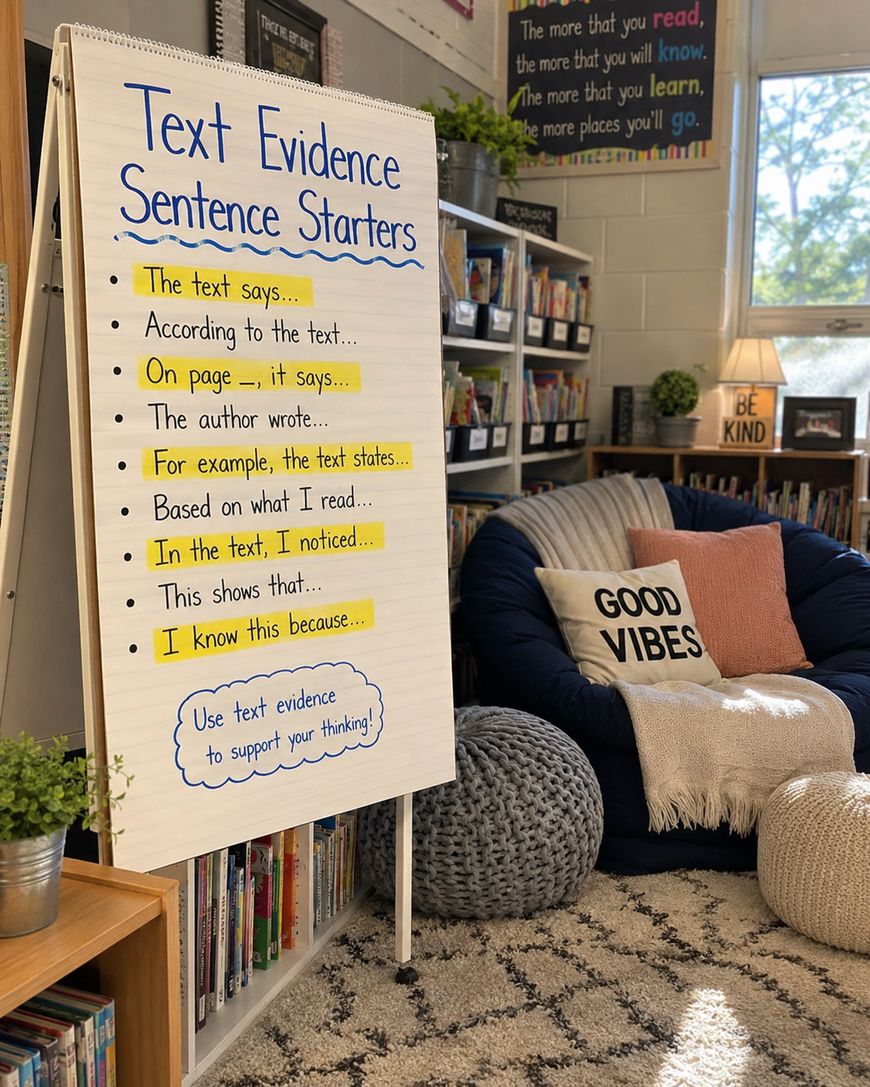
For upper elementary, a “Text Evidence Sentence Starters” chart gives students the language they need to cite sources in writing. Phrases like “According to the text,” “The author states,” and “This shows that” become second nature when students see them posted and use them daily.
Math Anchor Chart Ideas for Every Grade
Math anchor charts work best when they are built during a lesson as a class, so students watch the thinking unfold rather than receiving a finished product.
A “Problem Solving Steps” chart walks students through read, plan, solve, and check using a consistent visual each time. When this process is displayed all year, students internalize it as a habit rather than a one-time strategy. Pairing the chart with worked examples of each step helps students who need concrete models.
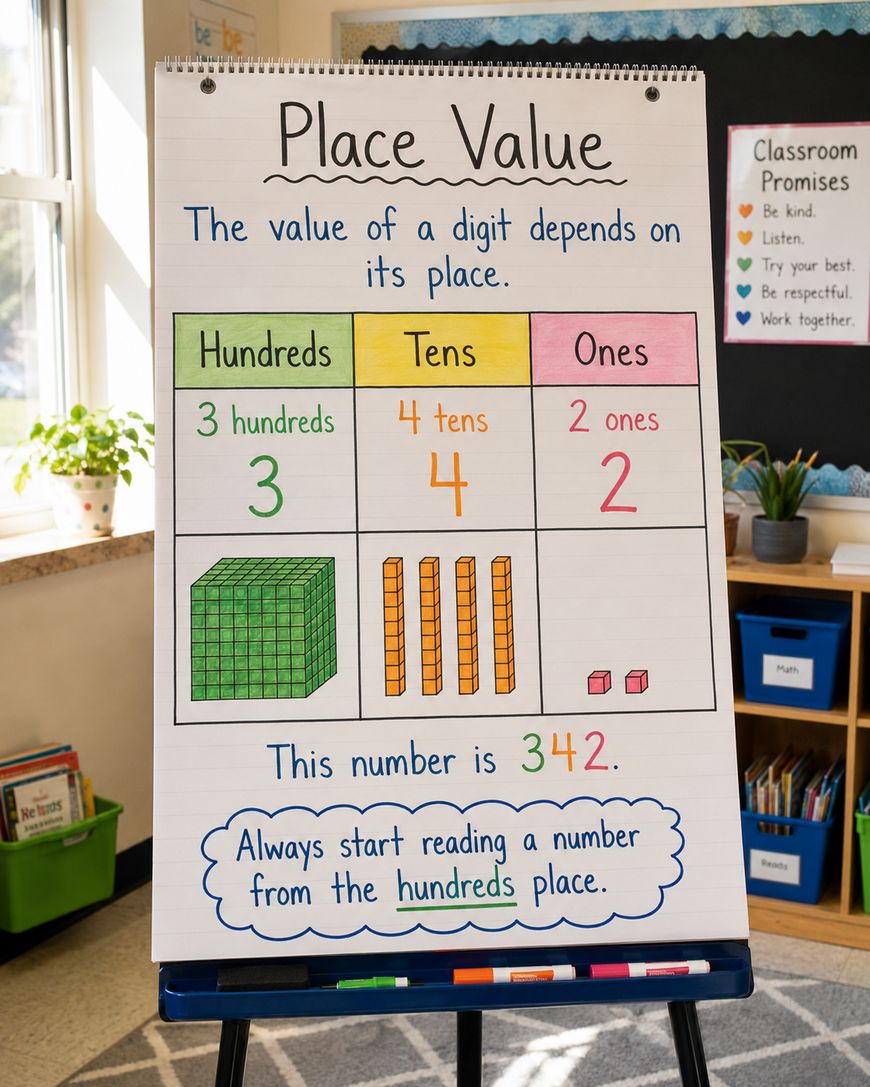
Place value anchor charts are perennial classics for K-3. A chart showing ones, tens, and hundreds blocks alongside the written and standard form gives students three representations of the same number. Color coding each place value column in a consistent color across all your math charts creates a visual thread students follow from lesson to lesson.
For geometry, a “2D vs. 3D Shapes” chart with hand-drawn examples and real-world photos helps students make connections to the world around them. Including the number of sides, corners, and faces on the chart turns it into a genuine reference tool rather than just a vocabulary poster.
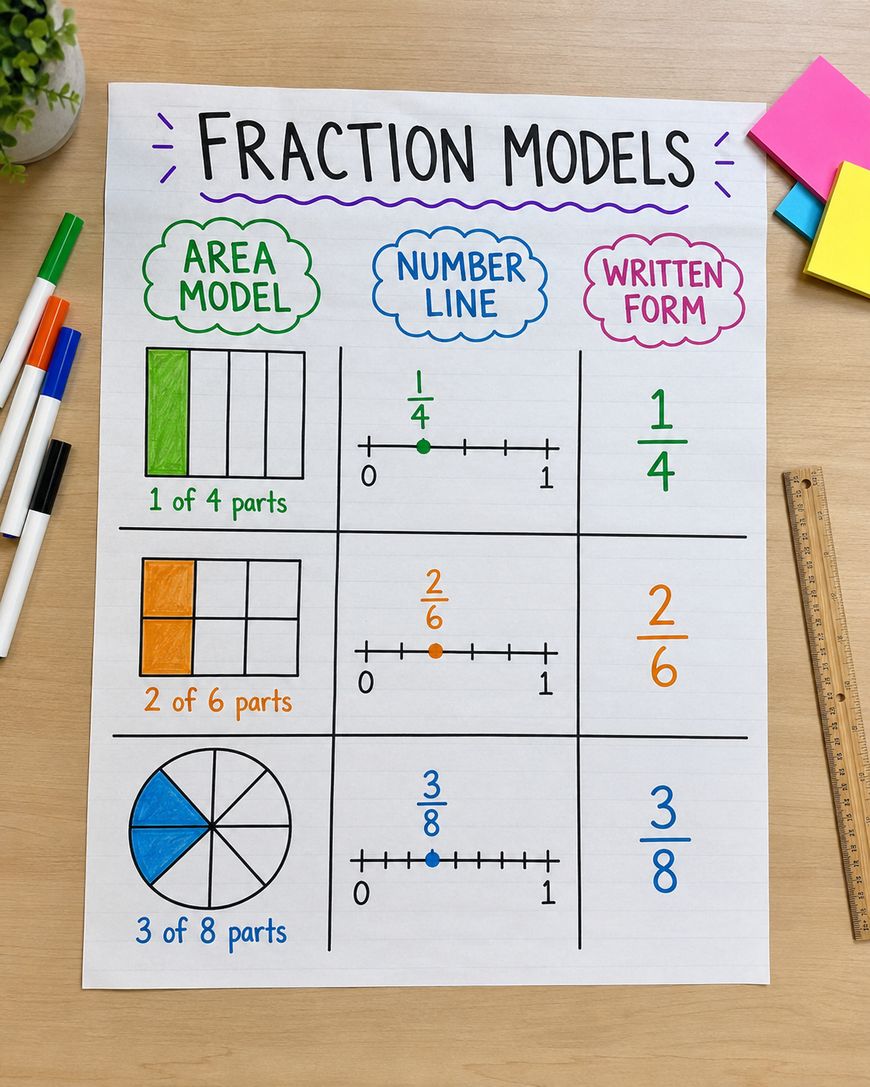
Fraction anchor charts tend to come up year after year because students need multiple exposures to fractional reasoning. A chart showing the same fraction represented as a model, on a number line, and in written form addresses three different learning modalities at once. Students who struggle with abstract fraction notation often find the number line representation clicks for them when they see it alongside the area model.
For middle grades, an “Integer Operations” chart showing rules for adding, subtracting, multiplying, and dividing positive and negative numbers with worked examples heads off a huge number of procedural errors. Color coding positive numbers in one color and negative in another makes the patterns visible and memorable.
Science and Social Studies Anchor Charts
Content area anchor charts help students build academic vocabulary and understand complex concepts over time.
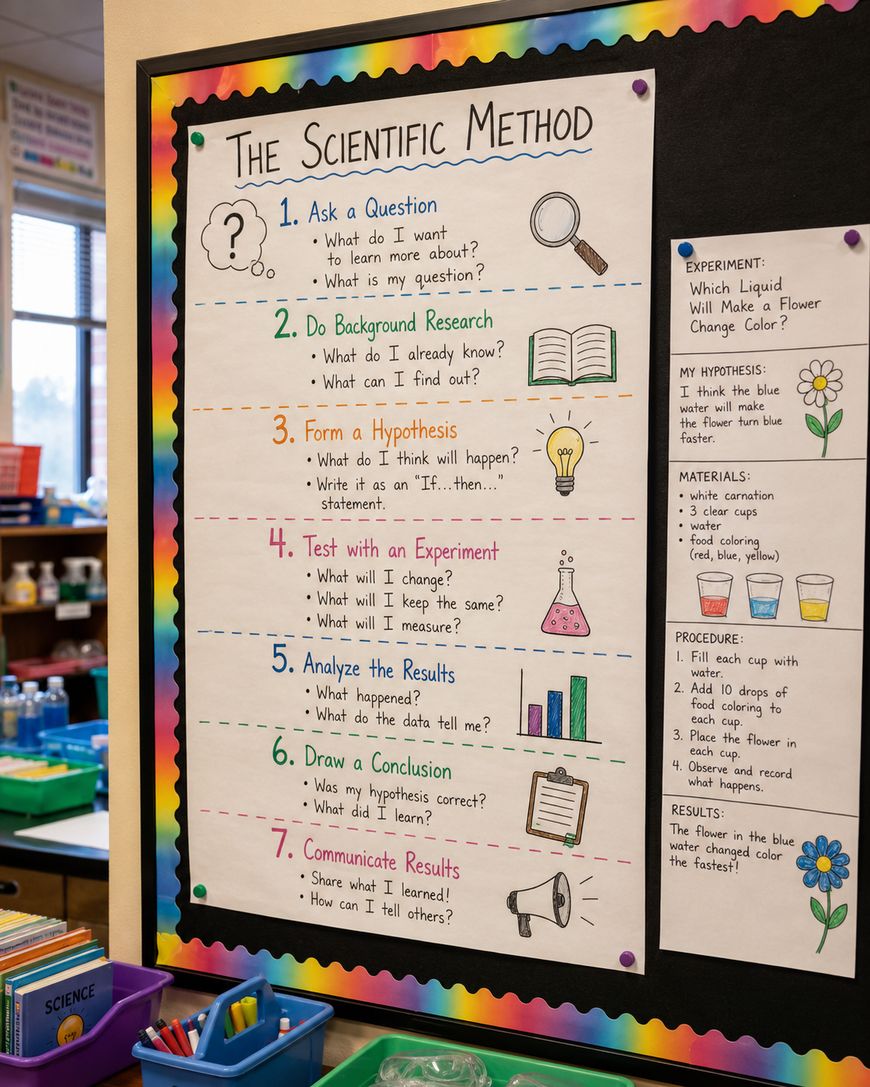
A “Scientific Method” chart with each step labeled and a brief description under it is a classroom staple, but you can take it further by adding a class-specific example to each step during your first experiment of the year. Students love seeing their own class’s work reflected in the chart and refer to it far more often when it feels personal.
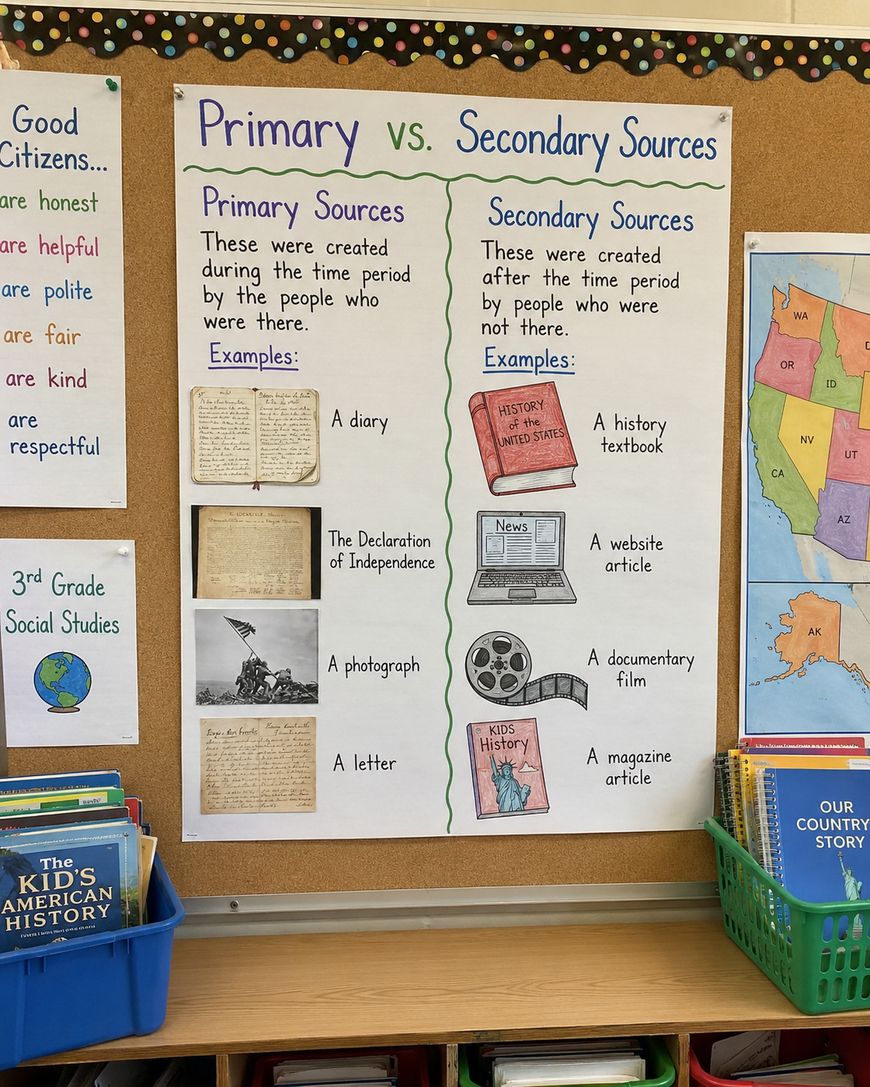
For social studies, a “Primary vs. Secondary Sources” chart with examples of each type in the two columns helps students think critically about historical evidence. Adding photographs of actual primary sources alongside the definitions grounds the vocabulary in something concrete.
A “Map Skills” anchor chart covering compass rose, map key, scale, and grid coordinates is essential for geography units. Breaking down each component with a simple visual gives students an accessible reference whenever they work with maps independently.
Earth science vocabulary charts for topics like the water cycle, rock cycle, or layers of the Earth benefit from large, labeled diagrams drawn directly onto the chart paper. When students can trace the process visually, they understand the connections between steps rather than memorizing isolated facts.
How to Display and Organize Anchor Charts
Even the best classroom anchor chart ideas lose their power if students cannot find or see them. Display strategy is just as important as content.
Grouping charts by subject in different areas of the room creates natural reference zones. Students know to look at the reading wall during reading time and the math wall during math. Rotating charts in and out of active display keeps the space manageable without losing access to older charts permanently.

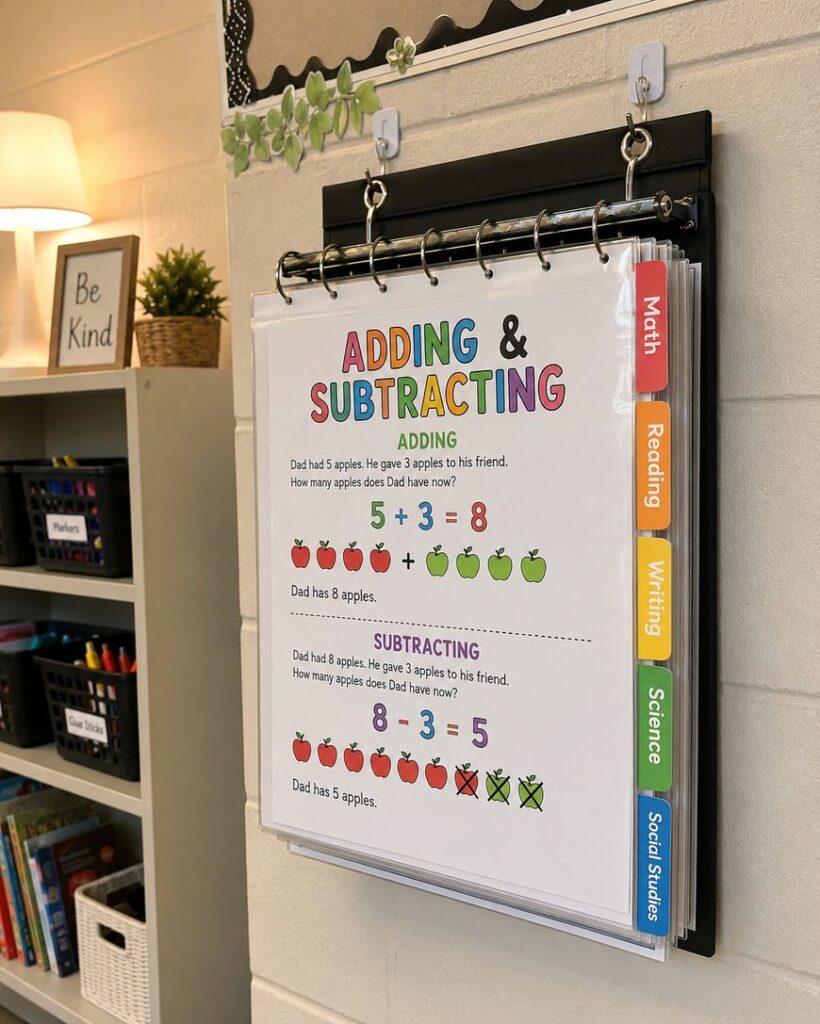
A ring binder system works brilliantly for retired charts. Hole-punch each chart, clip them onto a large binder ring, and hang the ring in the appropriate subject area. Students can flip through past charts whenever they need them, and your walls stay focused on current learning.
Taking photos of each chart as you make it and saving them to a shared folder or class website gives students access at home and during digital work time. Several teachers laminate a set of mini chart photocopies for student binders or reference folders so every student has a personal copy of the most-used references.
What Makes a Great Classroom Anchor Chart
Not every anchor chart earns its wall space. The best classroom anchor chart ideas share a few things in common: they are co-created with students, written in kid-friendly language, and referenced consistently throughout a unit rather than posted and forgotten.
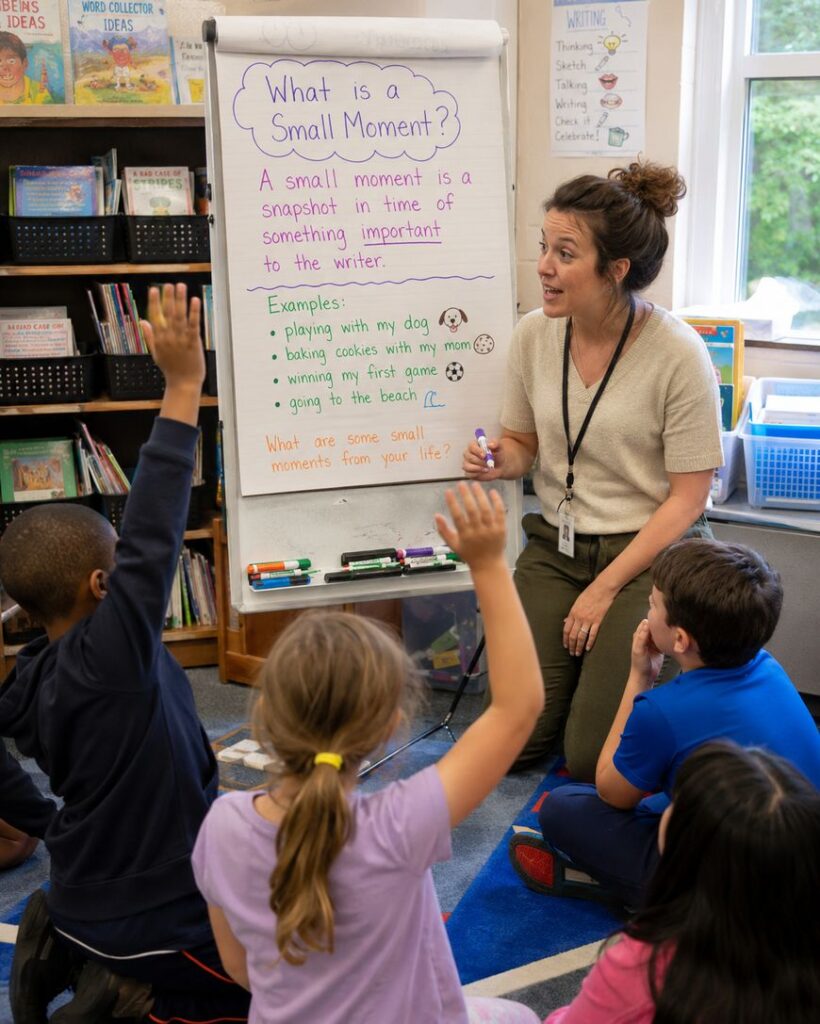
Think of an anchor chart as a tool, not a decoration. When students help build it during a lesson, they develop ownership over the content and are far more likely to use it as a reference later. Color coding, simple visuals, and clear headings all help students quickly locate the information they need.
Size matters too. Charts that are too small get ignored, and charts crammed with text overwhelm readers. Aim for large, bold headers with breathing room between sections. Using a consistent color system across charts in your classroom also helps students navigate information faster.
Laminating your most-used charts or covering them with clear contact paper extends their life significantly. You put real time into creating these resources, so protecting them means you can pull them out year after year with minimal touch-ups.
Frequently Asked Questions About Classroom Anchor Charts
How many anchor charts should be displayed at one time?
Most classroom management experts suggest keeping between eight and twelve charts visible at once so the space does not become visually overwhelming. Rotate older charts out as you move to new units, but keep them accessible in a ring binder system or chart stand.
Should students help make anchor charts or should the teacher prepare them ahead of time?
Co-creating charts during a lesson is generally more effective because students are engaged in the thinking process as the chart develops. That said, you can sketch a light pencil outline ahead of time to make sure the layout fits neatly on the paper without running out of room.
What supplies do you need for making anchor charts?
You need large chart paper or poster board, thick markers in several colors, and a ruler for keeping lines straight. Many teachers also use sticky notes for student contributions, highlighters for emphasis, and printed photos or clip art for visual support.
How do you make anchor charts last longer?
Covering finished charts with clear contact paper or having them laminated at an office supply store protects them from moisture, fingerprints, and general wear. Storing retired charts flat in a large portfolio or rolled in a poster tube also helps preserve them for future use.
Can anchor charts work for digital or hybrid classrooms?
Absolutely. You can create digital anchor charts using tools like Google Slides, Canva, or Jamboard and display them on a projector or share them in your learning management system. Some teachers photograph physical charts and post them as reference resources in their digital classroom.
What is the ideal size for a classroom anchor chart?
Standard chart paper measuring 24 by 32 inches works well for most classrooms because it is large enough to be seen from student seats but manageable to write on. For whole-class instruction, going slightly larger ensures students in the back rows can read the content clearly.
Start Building Your Anchor Chart Collection Today
The best classroom anchor chart ideas are the ones you actually use consistently, not the ones that just look beautiful on a wall. Start with one subject area, build charts alongside your students, and commit to referencing them throughout every lesson.
When students know the charts are there to support them, they stop depending on the teacher for every answer and start building the habit of using resources independently. That shift is exactly what great classroom anchor chart ideas are designed to create.
Pick one idea from this post, grab your markers, and make your first chart with your class this week. You will be surprised how quickly it becomes a cornerstone of your classroom culture.


Leave a Reply